Inside Pulsar: Faster Mac Inference, Measured End to End
Making a 27B model fast on one Mac: the speed gains, the moving baseline, and the kernel and drafter experiments that failed.
 Written by Abhishek Gahlot
The goal was to make a 27-billion-parameter model fast enough to use as a coding assistant on one Mac. The target was 200 tokens per second on coding prompts of roughly 5,000 to 10,000 tokens, starting from Splash and comparing the result with MLX-LM and other local engines.
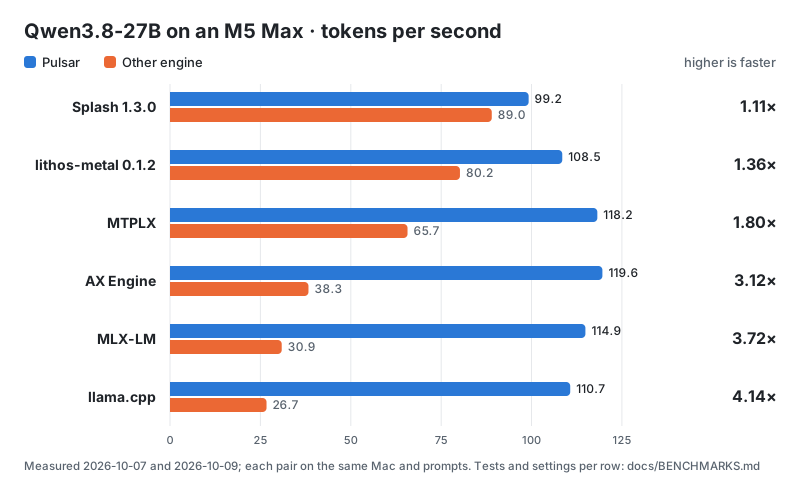
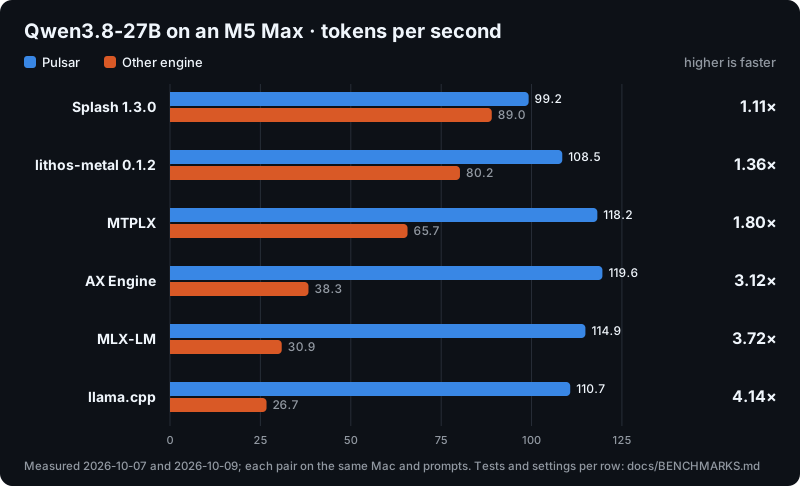
Pulsar reached 452 tokens per second at its one-second peak and 321 on average in a recorded file edit. In the paired engine comparisons, it delivered 3.72× MLX-LM's throughput and 4.14× llama.cpp's. Those results came from Pulsar 1.1.0; the engine comparisons below also include the later 1.1.3 release.
A token is a word or part of a word. At these speeds, the difference is visible: a file appears in a few seconds instead of arriving line by line. The gains also vary with the task. Copying and editing existing code gives the engine opportunities that an open-ended answer does not.
The difference on screen
The same 708-token answer took 3.97 seconds with Pulsar, 4.07 with Splash and 23.1 with MLX-LM. The recording makes the difference easier to see than a throughput number alone.
A moving baseline
Pulsar began as fastkernel, a set of changes on top of Splash. The first release was 1.31× faster than Splash 1.1.0. Then Splash 1.3.0 arrived with improvements of its own. After rebasing, the lead was 1.11×.
That changed the problem. Beating an old baseline was no longer useful. Further gains had to survive comparison with the newer runtime, including its better kernels and prefill path.
Two larger bets failed to deliver. The persistent megakernel ended up 2.7% slower than optimized separate kernels. Roughly $400 across five drafter-training rounds produced no serving gain. Better-looking intermediate results did not translate into faster answers.
The useful changes were smaller: avoid moving state that would be discarded, reduce the cost of choosing tokens, and start GPU work as soon as its inputs were ready.
Where the speed came from
Speculative decoding lets a small model propose several tokens for the full model to check together. That small model is the drafter. One draft-and-check round can produce several useful tokens, but it also creates work that ordinary single-token decoding never needs: proposal selection, rejection and state repair.
Pulsar reduces costs around those operations. Skinny Q4 projections use specialized schedules. Input sums are prepared alongside their producers and reused by the next operation. A restricted draft head reduces vocabulary work, and a specialized top-32 sampler makes eligible sampling policies cheaper.
There is also useful overlap. GPU draft-ahead starts the next draft from the acceptance result while the CPU handles the current output. Streamed submission lets the GPU start the ready part of a graph while the host encodes the rest. Neither requires waiting for the CPU to finish work that the GPU does not depend on.
A prediction worth a quarter of a millisecond
The Gated DeltaNet recurrent mixer maintains a state matrix as tokens arrive. Speculative execution can update that state for tokens that will later be rejected. Writing the whole speculative state and immediately replacing it wastes memory traffic.
The no-store path avoids that write. Deferred commit takes the next step: replay the accepted updates during a later scan instead of rereading the old state in a separate operation.
The extra read was about 151 MB. At the measured streaming reference of roughly 570 GB/s, its transfer time is about 0.265 ms. The component measurements landed close to that prediction: 0.289 ms saved at 2K context and 0.230 ms at 32K. In the complete serving test, deferred commit lowered decode time by 0.46%.
A quarter of a millisecond is small. It is also a concrete piece of work that disappeared, with the same text produced before and after the change.
State handling supplied its own bugs. One buffer check still assumed seven replay rows after a path began replaying eight. Large serving allocations hid the mismatch. A deliberately undersized buffer exposed it. Improving the fast path also meant testing the boundaries that ordinary requests rarely reach.
Why file edits are much faster
A pasted-file edit contains much of its answer in the prompt. Prompt lookup can propose those repeated spans cheaply, then have the target verify them in wider blocks. The engine spends less time inventing the next fragment when the fragment is already available.
That is the workload behind the 452 peak / 321 average tok/s recording from Pulsar 1.1.0. The later Pulsar 1.1.3 edit recording reached 445 peak / 321 average, compared with Lithos's 160 peak / 142 average on the first recorded run. Peak here means the busiest one-second delivery window.
The earlier three-engine edit recording shows the same task against Splash and MLX-LM: 8.2 seconds for Pulsar, 11.7 for Splash, and 64.5 for MLX-LM.
The replay below uses the later recordings. It preserves their arrival timing and displays a matched 1,884-token prefix.
The tip-calculator task has less existing text to reuse. Pulsar's three recordings averaged roughly 145–151 tok/s, with a 206 tok/s one-second peak. Lithos averaged about 112 tok/s. This difference between editing and generating is why one attractive coding demo cannot describe every workload.
From generated code to a running app
The particle-galaxy demo shows both stages: generating the application and running the result. Pulsar wrote 3,124 tokens in 20.9 seconds, compared with 22.1 seconds for Splash for the same token count.
The 35B mixture-of-experts model
Pulsar also runs Qwen3.6-35B-A3B. It is a mixture-of-experts model: only part of the model participates in each token, so its total parameter count does not imply the same work as a dense model of that size.
On the same six prompts, Pulsar 1.1.0 reached 268.1 tok/s with sampling and 299.6 tok/s with greedy decoding. Splash 1.3.0 recorded 260.9 and 276.1 tok/s, respectively. These are the October 7 results from the Pulsar benchmarks.
Operating conditions
Heat and power state affect the time available to each kernel. Unchanged stock code measured 35.70 to 37.91 ms per cycle across recorded operating conditions. That variation is larger than several of the optimizations under test. Initialized kernels, a warmed GPU and a cached prompt describe different aspects of the machine's state.
Results across ten prompts
Pulsar 1.1.3 delivered 1.365× the client-observed decode throughput of lithos-metal 0.1.2 across the ten-prompt local greedy comparison. Pulsar was faster on every prompt, with paired ratios from 1.129× to 1.660×.
one disclosed ten-prompt session
40-core M5 Max · greedy · 1,024-token cap · one ABBA session. Bars show means of two repetitions; ratios use paired geometric aggregation. Different quantized targets and drafters. Quality parity and between-session uncertainty were not measured.
Download the 40 raw request records ↗The next bottleneck
The broadest gains came from changing how much useful work each round produces. The smaller, repeatable gains came from removing specific work within that round. Both matter once the baseline is already good.
The remaining drafter opportunity is choosing better continuations from the candidate pool without paying for target information to choose them. The remaining kernel opportunity is finding schedules that suit the narrow projections while preserving the required arithmetic. Those are concrete problems to pursue from the current measurements.
Pulsar is available in the repository. The release described here is 1.1.4, built on Splash 1.3.0; the measurements retain their original versions.
Methods, exact results and measurement conditions
Operating conditions and measured cycle time
Stock code measured about 35.70 ms per cycle in a high-P-state sequential test, against earlier readings of 36.31, 37.48 and 37.91 ms. That spread matters when the optimization under test saves a few tenths of a millisecond. The device's operating conditions can move the result by more than the code change.
| Recorded observation | Result | Interpretation |
|---|---|---|
| Stock code in a high-P-state sequential test | About 35.70 ms/cycle, versus earlier 36.31 / 37.48 / 37.91 ms | Operating conditions moved cycle time; sequential order was not balanced |
| P-state regression across 36 requests | One higher P-state associated with about 0.880 ms lower cycle time | A diagnostic association; P-state IDs are not calibrated MHz, and frequency was not independently controlled |
| Candidate/reference before an external fan was added | Time ratio 1.0006, 36 pairs | Nearly unchanged in this subset |
| Candidate/reference with the fan | Time ratio 0.9895, 60 pairs | Different requests and times; the two subsets do not isolate a causal cooling effect |
| Thermal-status disagreement | pmset: nominal; IOReport: fair | One coarse thermal label did not capture every relevant operating-state difference |
The fan was added during the October 7 ab112 session, after which mean P-state climbed. That condition change belongs beside the timings. Crediting the whole improvement to the candidate code would hide it.
“Warm” needs a more precise description:
| Condition | What has changed |
|---|---|
| Initialized | Pipelines, buffers and layouts are prepared |
| GPU-warmed | Representative GPU work has established a repeatable operating regime for the intended test |
| Thermally sustained | Enough work has run to expose the sustained power and cooling regime; this can be slower than a recently warmed device |
| Cache/residency state | Prompt-cache reuse, resident pages, compression and competing models affect the work or its memory-access cost |
A prompt-cache hit can remove prefill while the GPU is cold. A long GPU warm-up can eventually reach a lower sustained clock regime. Neither condition follows from initialization alone.
These experiments measured cycle-time/P-state behavior and a separate streaming-bandwidth reference. They did not establish a matched hot-versus-cool bandwidth curve. A lower GPU frequency can reduce kernel throughput without showing that DRAM bandwidth fell by the same percentage. The measurement supplement records the conditions and source experiments.
Predicting a state-read saving, then measuring it
Deferring the Gated DeltaNet (GDN) state commit targeted an extra read of about 151 MB of recurrent state. Using 570 GB/s, roughly the best recorded rate from a separate streaming probe, gives a conditional estimate:
151 MB ÷ 570 GB/s ≈ 0.265 ms.
That predicts the scale of one transfer at that reference rate. The probe's best configurations were not a validated sustained thermal bandwidth ceiling. The next checks measured the actual block-mode change and then serving, on top of no-store:
| Check | Measured result | Scope |
|---|---|---|
| Deferred commit at 2K | −0.289 ms/cycle, interval [−0.340, −0.209] | Qualified block-mode component check |
| Deferred commit at 32K | −0.230 ms/cycle, interval [−0.243, −0.179] | Qualified block-mode component check |
| Deferred commit on/off in serving | Decode-time ratio 0.9954, interval [0.9915, 0.9993] | 84 identical-text pairs, on top of no-store |
The component result landed near the predicted hundreds-of-microseconds scale. The serving result was about 0.46% lower decode time in its own cohort. That smaller end-to-end gain is the result to carry into a serving claim. The source measurements keep the transfer estimate, component checks and serving comparison separate.
Changes within a speculative cycle
Reusing projection inputs
Q4 projections have shapes where a general matrix schedule leaves too little parallel work. Pulsar specializes skinny projections and prepares reusable input sums alongside their producers. The next operation can consume that preparation instead of computing it again.
Changing a K partition or fused-multiply-add order can change rounding, and a small logit difference can change a greedy decision or a sampled trajectory. The right control gives both implementations the same packing and geometry before crediting a gain to fusion.
Avoiding discarded state writes
The Gated DeltaNet (GDN) recurrent mixer keeps a state matrix that each token updates. GDN value parts parallelize independent value columns while preserving token recurrence order. More columns can run together; the update for a later token still depends on the earlier token's state.
A speculative block introduces another opportunity. If only a prefix survives, storing the full speculative recurrent state can create work that commit immediately replaces. The no-store path avoids that write where qualified. Deferred commit replays retained updates inside a later scan, avoiding a separate reread of the old state.
Deferring a write is safe only when every reader sees the logically committed prefix. Snapshots, route changes and other state consumers must settle pending updates. Full retention must also produce the correct state; it cannot inherit assumptions from a partial-prefix path.
The eight-row path needed an eight-row check
One buffer-extent check still assumed seven replay rows after a new path began replaying all eight. Full-size serving arenas hid the mistake: the backing allocation was large enough even though the check described the wrong boundary. A one-element-short test against the new path exposed it.
The bug sat at the boundary between two replay paths. Partial retention, full retention and replay each select work with different buffer requirements. Their checks need rejected suffixes, stop tokens, output budgets, mixed batches and request lifecycle; a passing partial-prefix case does not cover a full-retention commit.
Proposal selection and sampling
The restricted draft head reduces vocabulary work through a runtime head mapping and fallback. The target vocabulary and verifier remain authoritative. Changing the proposal head can change q, so the verifier must use the distribution that actually proposed the token.
Draft temperature and top-p can also differ from the target policy. Their value is measured in useful tokens per complete cycle. Better teacher loss alone does not establish a serving gain.
Eligible small top-k policies use a specialized TOPK32 sampler. Its ties, probability mass, fallback and single-instruction, multiple-data (SIMD) participation must match the intended policy. Sampled lanes can also use named Block Verification, with its matching correction procedure. The classical acceptance formula cannot simply be substituted into that joint algorithm.
Draft-ahead and streamed submission
GPU draft-ahead derives the next anchor and inputs from GPU acceptance, then drafts while the CPU handles the current result. The next draft still depends on that verification. Its result can be adopted only when request, position, random-number state and head state match.
Streamed submission tackles another host gap by starting a useful head of GPU work while the host encodes the rest. Event ordering and exception ownership remain part of the implementation. An earlier submission is not useful if a failed request can leave work using released buffers.
Prompt lookup for repeated text
For a pasted-file edit, much of the desired answer may already occur in prompt or history. Prompt lookup proposes that text cheaply, and the target still verifies every proposal.
Pulsar can verify 16 or 32 rows where row-stable arithmetic has been qualified. This is a wide lookup route, not deployed native DFlash depth16. A copy-heavy task can benefit much more than an open-ended response, which matters when choosing a demo to represent the engine.
The implementation map and runtime switches are in What we built and Switches.
Hardware boundaries
GPU Neural Accelerators are matrix resources reached through the GPU programming path on supported hardware. Apple Neural Engine, or ANE, is a separate execution engine.
Sending work to ANE introduces its own supported shapes, precision choices, packing, weight staging, handoffs and scheduling costs.
More hardware is useful when the work can actually run concurrently and the handoff does not erase the saving. It does not create a second independent copy of the Mac's memory bandwidth.
A split prefill operation can be attractive because it has many token rows and substantial arithmetic. A tiny decode block may have a very different balance.
The next draft also depends on the retained tokens and target features from the current verification. Moving that draft to another engine does not remove those dependencies. Starting it earlier requires a different speculative strategy, with its own adoption and correction rules.
Prefill and time to first token (TTFT) describe a different part of the request from decode throughput. An improvement in one can leave the other unchanged.
Component and release measurements
These historical measurements cover different scopes. They cannot be added together to predict a current release's serving speed.
| Change | Recorded result | Measurement boundary |
|---|---|---|
| Draft-ahead | About 0.257 ms saved per cycle | Matched 36-pair serving cohort; later lookup-aware gating avoided wasted ahead blocks |
| TOPK32 | About 0.14 to 0.23 ms saved per cycle | Sampled component/cycle checks |
| GDN no-store | About 0.20 ms saved | Sampled B1, qualified lockstep |
| GDN deferred commit | Component and 84-pair serving results above | Serving comparison adds defer on top of no-store |
| Combined 1.1.3 versus 1.1.1 | Decode-time ratio 0.9910, interval [0.9880, 0.9939] | 96 identical-text pairs over eight rounds |
The 96-pair combined-release comparison is a separate cohort from the 84-pair deferred-commit comparison. It measures the release change as a whole; adding the component savings would count overlapping work more than once. Concurrent aggregate throughput also answers a different question from one user's decode speed.
The complete local Lithos comparison
The clean run measured the headline client-observed decode result, using the geometric mean of twenty matched comparisons over ten prompts. Both halves agreed: 1.364517× and 1.365048×. Every prompt favored Pulsar in this session.
| Condition | Setting |
|---|---|
| Hardware and OS | 40-core M5 Max, 128 GB unified memory, macOS 27.2 |
| Engines | Pulsar 1.1.3 and lithos-metal 0.1.2 |
| Target / draft | Pulsar's Qwen3.8-27B Q4 + DFlash 2; Lithos's Qwen3.8-27B NVFP4 + DSpark |
| Decoding | Greedy, thinking off, output capped at 1,024 tokens |
| Order | Pulsar, Lithos, Lithos, Pulsar; one benchmark server at a time |
| Other model server | Stopped for this run |
| Coverage | Ten prompts, two repetitions per engine, forty recorded requests |
| Metric | Client-observed decode rate, defined as (completion tokens − 1) / (last − first content event) |
| Uncertainty | Prompt-bootstrap interval for this session: [1.262, 1.479]× |
All ten prompts
Rates are the mean of each prompt's two repetitions. The ratio is the geometric mean of the paired rate ratios. Completion counts repeated within each engine; they were not necessarily equal between engines.
| Prompt | Pulsar tok/s | Lithos tok/s | Ratio | Completion tokens Pulsar / Lithos | Finish Pulsar / Lithos |
|---|---|---|---|---|---|
| aya-0 | 62.2 | 55.1 | 1.129× | 144 / 130 | stop / stop |
| h-chat-1 | 80.4 | 61.3 | 1.311× | 1024 / 1024 | cap / cap |
| h-chat-2 | 91.4 | 56.3 | 1.623× | 844 / 750 | stop / stop |
| h-chat-3 | 88.8 | 55.7 | 1.597× | 264 / 207 | stop / stop |
| h-chat-4 | 92.4 | 55.7 | 1.660× | 1024 / 1024 | cap / cap |
| lithos-demo | 136.0 | 105.2 | 1.293× | 1024 / 1024 | cap / cap |
| magicoder-0 | 180.8 | 144.3 | 1.253× | 114 / 114 | stop / stop |
| numina-0 | 166.0 | 116.3 | 1.427× | 374 / 384 | stop / stop |
| r3-0 | 101.8 | 84.8 | 1.199× | 148 / 228 | stop / stop |
| ultrachat-0 | 85.0 | 67.0 | 1.270× | 1024 / 1024 | cap / cap |
The mean of per-prompt mean rates was 108.5 versus 80.2 tok/s. That ratio is a different aggregation from the primary 1.365× paired geometric mean.
Download all forty request measurements. Benchmark conditions and provenance.
Scope of the comparison
The targets use different quantization and the drafters differ. This tests complete stacks; equal task quality and the contribution of individual kernels were not established. Four prompts capped on both engines, so the result measures bounded decode throughput rather than finished-answer latency. Long-context prompts were excluded; there is no 32K result here.
The prompt-bootstrap interval describes variation across these prompts in one session, not repeatability across sessions, Macs or operating systems. Greedy repetition gives repeated timings rather than independent sampled generations. The prompt order also stayed the same within each block, so context and recipe effects can track elapsed time.
Lithos ran two warm-up requests, fewer than the six observations its trend detector needed. A steady-state plateau was therefore not established. Some measured requests incurred substantial setup before first content, which the primary decode interval excludes. Those timings do not measure warmed prefill performance.
The client rate uses completion tokens minus one between first and last content events. That assumes the excluded first event contains one token; a streaming event can contain several, so that assumption needs verification. Usage counts, stream errors and a valid terminal event also matter even when HTTP status is 200.
The launch-video workload
Lithos's October 8 launch video shows 201 tok/s peak, 175 tok/s average and 1.16 s TTFT for a tip-calculator coding request. Those are the video's displayed measurements. Its separate 168/127 chart is a target-compute projection with assumed acceptance, so the chart and the demo are different evidence. Blog and demo
The comparison included the visible tip-calculator prompt. With the disclosed 1,024-token cap and greedy configuration, Pulsar averaged 136.0 tok/s and Lithos 105.2 tok/s, a 1.293× paired ratio. Both answers reached the cap.
The video leaves settings, output length, cache conditions and runtime details unspecified, and its machine/software conditions differ from this run. The result does not disprove the displayed 175 average or establish fabrication or deliberate selection. A selected coding demo or peak window has a narrower scope than general workload performance. The full table includes both the 1.660× chat result and the 1.129× multilingual result.
Recorded tip-calculator and edit demos
The tip-calculator and pasted-file-edit recordings used a 3,000-token cap, separately from the ten-prompt, 1,024-token-cap run. Each replay preserves the timing of separately recorded streams.
| Task / engine | Run 1 decode tok/s | Run 2 | Run 3 | Median |
|---|---|---|---|---|
| Tip / Pulsar 1.1.3 | 150.73 | 147.78 | 145.45 | 147.78 |
| Tip / Lithos 0.1.2 | 111.71 | 111.88 | 111.76 | 111.76 |
| Pasted-file edit / Pulsar 1.1.3 | 321.42 | 322.29 | 323.03 | 322.29 |
| Pasted-file edit / Lithos 0.1.2 | 142.46 | 142.63 | 141.86 | 142.46 |
Download the twelve recording measurements, including source hashes, caps, finish reasons, TTFT and cache metadata where available.
All tip runs produced 3,000 tokens and ended at the cap. The edit runs reported stop: Pulsar produced 1,894 tokens and Lithos 1,884. Task correctness of the edit outputs was not re-reviewed for this article.
Cache state matters especially for total latency. The first Pulsar edit request took 2,269.965 ms to first token; later repetitions took about 139 ms. Lithos's TTFTs were 3,280.238, 3,246.898 and 3,144.621 ms. Mixing warm-cache and cold-request timings would obscure that distinction.
One-second delivery peaks
The recorded streams also support a client-delivery view. Each complete answer was retokenized, with tokens assigned to the arrival time of the chunk containing their last character. Peak rate counts the most token arrivals within a one-second window.
| Workload and engine | One-second peak, tok/s | Retokenized average, tok/s | First content |
|---|---|---|---|
| Tip calculator, Pulsar, three runs | 206 in each run | 145.4–150.7 | About 0.11 s |
| Tip calculator, Lithos, three runs | 152–154 | 111.7–111.9 | About 0.21 s |
| Pasted-file edit, Pulsar, first run | 445 | 321.3 | 2.27 s |
| Pasted-file edit, Lithos, first run | 160 | 142.4 | 3.28 s |
These peaks describe bursty client delivery, not instantaneous GPU throughput. Retokenization counted 1,893 and 1,883 tokens for the edit, one fewer than each server's native count; that is why these averages differ slightly from the native-summary rates above. The method is not verified as identical to the launch video's overlay. Offline method and recording receipts
Older Splash/MLX speed-race and code-edit videos belong to a different 1.1.0 cohort.
From operator timings to serving results
A reproducible measurement depends on identifying and asserting the loaded source revision and patch, executable, native library and metallib fingerprints, model and drafter revisions, quantization, packed layouts, runtime switches and sampling policy. The launcher's resolved module or binary path matters: a working directory alone does not establish what ran.
For an elementwise kernel, the check can be a CPU reference with several tail sizes. For a projection, it needs real weights, representative inputs, odd boundaries and supported epilogues. The eight-row replay bug needed a boundary test against that specific state path.
The graph and serving loop can change the result of an isolated test. A split-K variant saved around 1.5 ms in a step test, but its much smaller serving effect did not support promoting that number as a user-facing gain.
| Measurement | What it answers | Work outside its boundary |
|---|---|---|
| Isolated operator | Is this kernel faster for this shape and data? | The rest of the model |
| Complete GPU graph | Does the change survive neighboring kernels? | Host and serving work |
| Native cycle counters | How much progress and time did the engine record? | Work outside those counters |
| Client streaming interval | What did this client observe while output arrived? | Setup before first content and completion afterward |
| Full request latency | How long until the user received the result? | It does not identify the cause by itself |
Warm-up stays outside measured counters and uses representative sustained work. GPU warm-up changes execution conditions; prompt-cache reuse can remove model work. Alternating matched baseline and candidate requests helps expose drift; power, cooling, background GPU use and memory pressure remain part of the measurement record.
If arithmetic changes sampled trajectories, the same seed may no longer mean identical work. Output lengths, retained tokens, cycles and end reasons are needed alongside speed, including incomplete and failed requests. Hundreds of cycles from one request are still one workload.
The forty-request download contains the clean comparison. The recording measurements contain the separate demo cohort.